- In 2020, nearly 42 million US women had a potential demand for contraceptive services and supplies, and 18.8 million were likely in need of public support for this care.
- Between 2010 and 2020, the number of women with a potential demand for contraceptive care rose steadily. The number of women who were likely in need of public support for this care rose 8% between 2010 and 2016 and then fell 9% between 2016 and 2020, shifts that generally mirror changes in the number of women living in poverty.
- As major components of the Affordable Care Act (ACA) were implemented, the number of women likely in need of public support for contraceptive services who had neither public nor private health insurance fell—from 5.8 million in 2010 to 3.6 million in 2016 and 3.0 million in 2020. States that implemented the ACA’s Medicaid expansion experienced particularly large declines in the numbers of women who were uninsured.
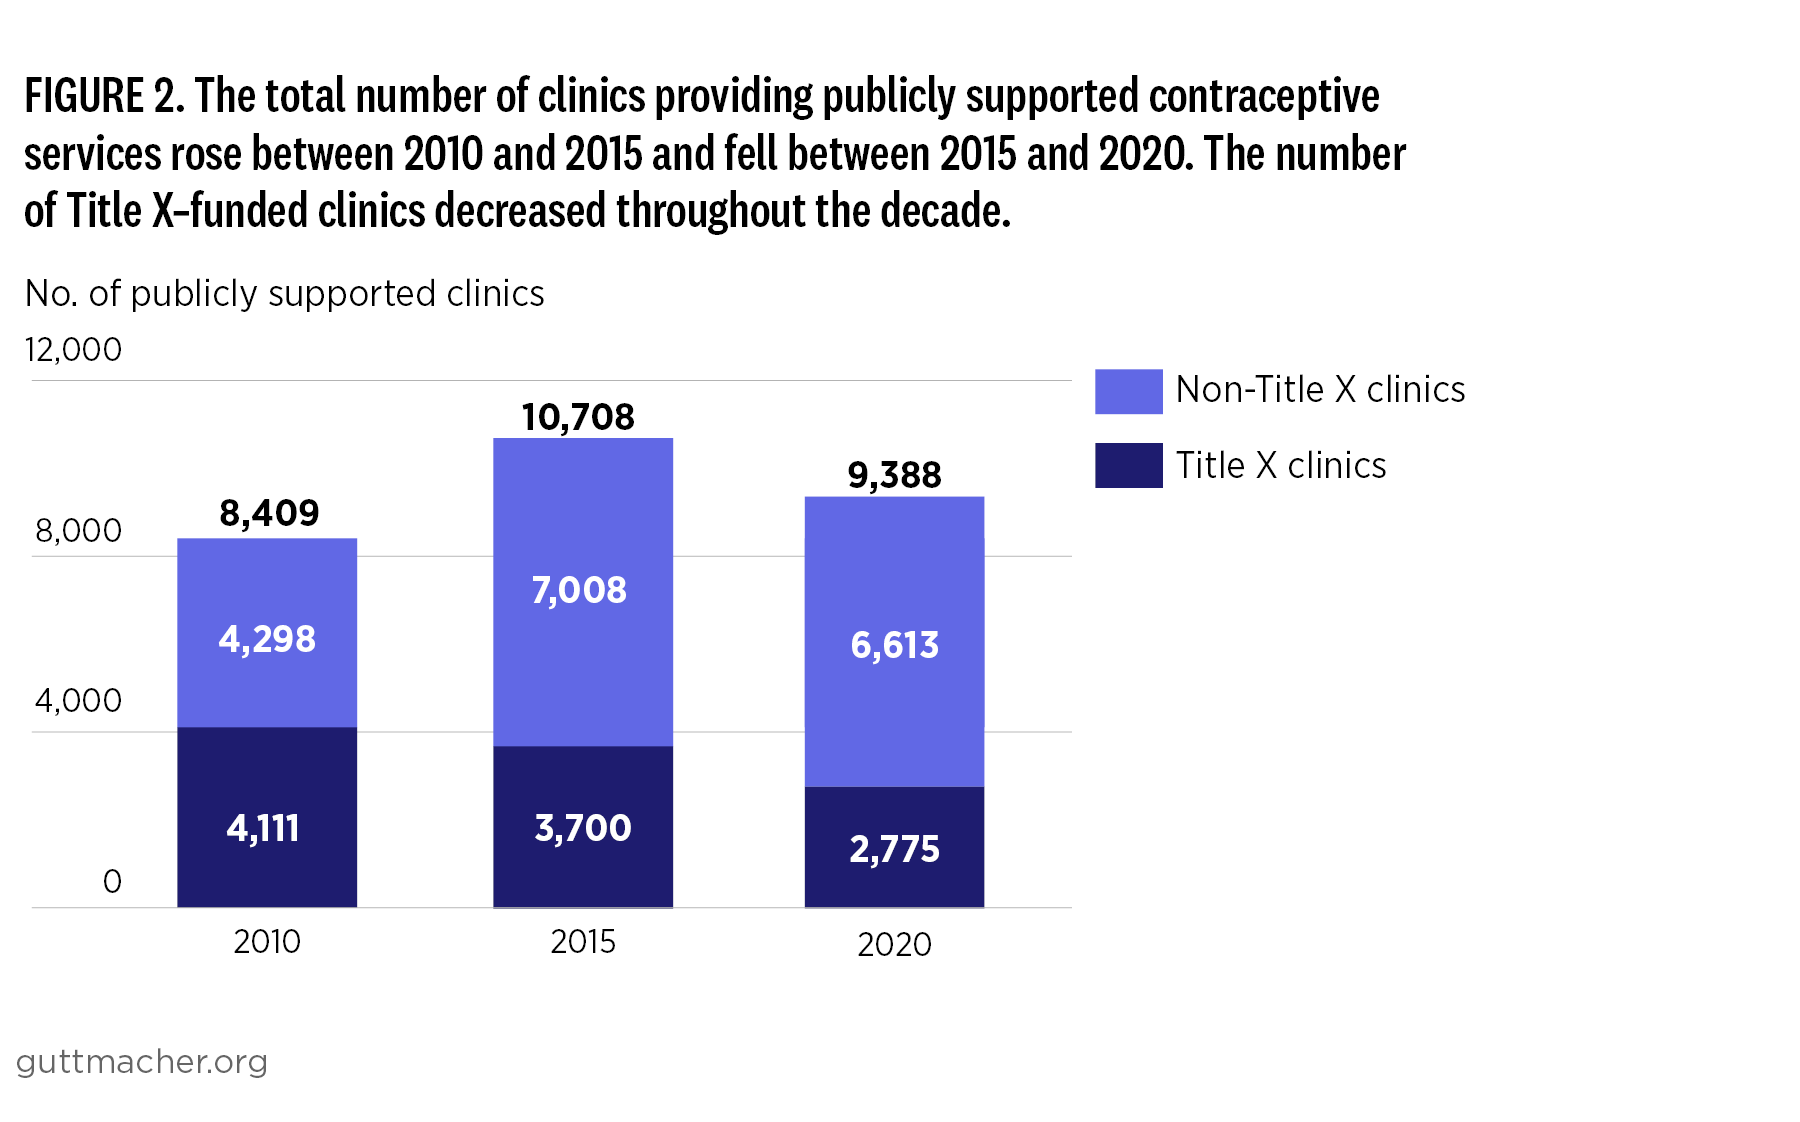
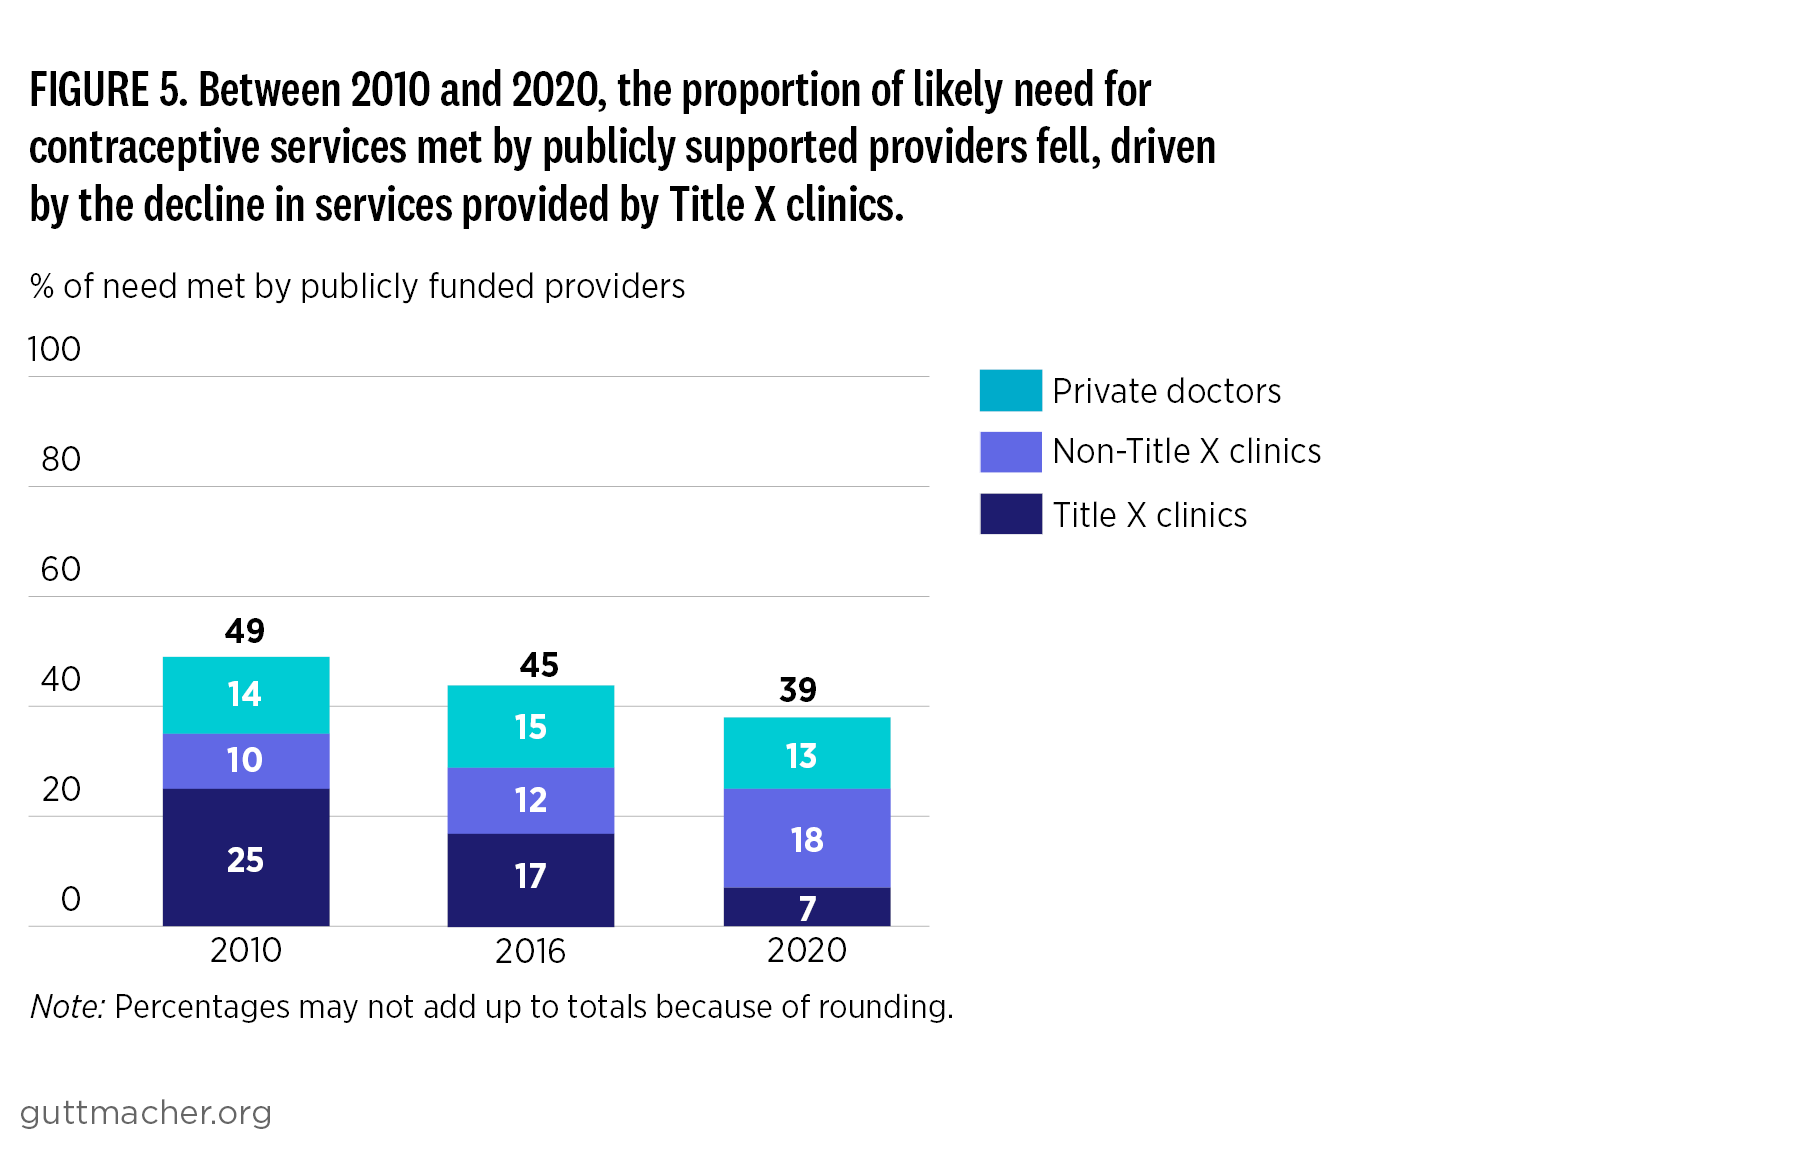
- The overall number of women receiving publicly supported contraceptive services also fell, from 8.9 million in 2010 to 7.2 million in 2020. This drop was due entirely to fewer women obtaining contraceptive care from publicly supported clinics.
- The number of women served by Title X–funded clinics fell over the decade, while the number of women served by clinics not receiving Title X rose dramatically.
- The Trump administration’s “domestic gag rule” and COVID-19 both contributed to large shifts in the publicly funded clinic network between 2015 and 2020. The combined impact of these events appears to have been greater on Title X–funded clinics than on other clinics.
Publicly Supported Family Planning Services in the United States: Likely Need, Availability and Use, 2020

Author(s)
Jennifer J. Frost, Nakeisha Blades, Ayana Douglas-Hall, Mia R. Zolna, Audrey Maynard, Samira M. Sackietey, Tamrin Ann Tchou and Bashiru MohammedReproductive rights are under attack. Will you help us fight back with facts?
Key Points
Introduction
Equitable access to contraceptive and other sexual and reproductive health (SRH) care services is fundamental for people to achieve their reproductive health and well-being.1 Most women use contraceptives at some point in their lives,2 and they need information on and access to the full range of available methods to ensure they can achieve their SRH goals—and obtain the methods that work best for their personal situation and current life stage. Many women, however, cannot afford to pay for contraceptives and related services; others, especially adolescents, may be concerned with confidentiality when seeking care, and therefore cannot use their parents’ health insurance for care. These women are among the many who turn to publicly supported clinics to obtain the care they need and want.
Publicly supported clinics have long been a critical source of contraceptive and other SRH care for adolescents and low-income adults in the United States, providing access for vulnerable populations and promoting SRH equity.3 This network includes sites that are funded through the national Title X family planning program, which is the only federal grant program dedicated to providing subsidized contraceptive and related SRH services, with a focus on serving individuals who are disadvantaged in their access to health care. It also includes other sites that receive public funding: federally qualified health centers (FQHCs), health departments, hospital outpatient clinics, Planned Parenthood sites, Indian Health Service sites, and other community or independent clinics. Each year, this network provides contraceptive and other SRH care to millions of patients nationwide.4,5
For decades, the Guttmacher Institute has monitored these trends, periodically publishing data on the numbers of clinics and contraceptive patients served in this network.3–6 In addition, women who are eligible for and enroll in Medicaid often obtain publicly supported contraceptive care from private providers.
Since Guttmacher’s last report on contraceptive needs and services was published in 2019,7 this network of publicly funded clinics has faced tremendous challenges.8 The first Trump administration’s enforcement of the 2019 Title X Final Rule (also called the “domestic gag rule”)8,9 led to nearly 1,000 clinics leaving the Title X program nationwide. This policy prohibited Title X recipient sites from providing abortion referrals or being co-located with abortion providers, mandated prenatal care referrals for pregnant women and removed the requirement to provide “medically approved” family planning methods.8 Many providers chose to leave the network rather than being forced to limit the range of SRH care that they could offer or discuss with their patients.10
In 2020, the COVID-19 pandemic further disrupted service provision.11 COVID-19 overwhelmed the US health care system, resulting in delays in care and cancellation of services, as well as lower service utilization by patients.12–15 In addition, restrictive state-level policies enacted during this period harmed SRH service provision. The detrimental impacts of these challenges, which have been documented widely,16,17 will be further examined in this report.
In addition to monitoring services provided by the network of publicly supported providers, Guttmacher periodically estimates the demand for these services—focusing on the number of US women who likely need public support to obtain this care because of their income or age.4–7,18–20 Specifically, these estimates represent the number of women who, at some point during the year, may seek contraceptive services or supplies because they desire to avoid or delay becoming pregnant, and are sexually experienced and able to become pregnant.
The conventional way of estimating need for contraceptive care assumes that population-level estimates of need can be predicted from people’s behaviors and characteristics. Guttmacher staff are currently engaged in revising this methodology and developing a more person-centered metric of need that better reflects and measures what people themselves say about their need for contraceptive care. However, this report and the estimates of potential demand for contraceptive care presented here do not reflect these revisions and are based on the conventional need metric. For comparison with prior rounds, the main report and tables present estimates for women aged 13–44; separately, in the Supplementary Tables, we present estimates for those aged 13–49, as future rounds will likely use the extended age range (see Key Definitions).
The definition used to estimate likely need for publicly supported contraceptive care builds off of the calculated potential demand for these services. It is further based on income level and age and represents eligibility for public support at Title X–funded clinics. Our estimates of likely need for publicly supported contraceptive care are not adjusted based on public or private health insurance status and include everyone who fits the age or income eligibility criteria.
This report provides updated estimates for 2020 for the following key indicators, which measure the likely need for, and actual provision of, publicly supported contraceptive and related SRH services:
- The numbers of women with a potential demand for contraceptive care and those who likely needed public support for contraceptive services and supplies according to age, income level, race and ethnicity, and health insurance status.
- The numbers of women who received contraceptive services at all publicly supported family planning providers, including those served at publicly supported clinics and Medicaid enrollees served by private providers.
Comparisons are made between the updated 2020 results and similar findings from earlier reports (for need, we compare findings from 2010, 2013 and 2016; for clinics and patients, we compare findings from 2010 and 2015). The purpose of this report is to highlight national-level findings and trends and to present cross-tabular summary tables of national and state data. Detailed county-level tables with estimates for these indicators are available as an additional download.
Key Definitions
- Female and women are terms that refer to individuals who may have the ability to become pregnant. In reality, the population of people able to become pregnant includes some (though not all) cisgender women, transgender men and people whose gender is nonbinary; however, the data sources used in our analyses do not provide extensive detail on respondents’ sex or gender. For example, the US census and the National Survey of Family Growth rely on individuals’ self-identification as women, and estimates of those receiving publicly supported care are based on providers reporting the number of individuals who are classified as female in their patient data systems.
- Potential demand for contraceptive services and supplies refers to women who are aged 13–44 (or 13–49 for the Supplementary Tables) and meet the following three criteria:
- have ever had voluntary penile-vaginal intercourse,*
- are able to or believe they are able to conceive (women who have not been sterilized nor have their partner(s), and who do not believe that they are unable to conceive for any other reason are included),
- are neither intentionally pregnant nor trying to become pregnant during all of the given year.
- Likely need for publicly supported contraceptive services and supplies is calculated based on the proportion of women who meet the above criteria and are aged 20 or older with a family income below 250% of the federal poverty level (FPL; less than $54,300 for a family of three in 2020)21 or are younger than 20. All adolescents who have a potential demand for contraceptive services, regardless of their family income, are assumed to have a likely need for public support because of their heightened need for confidentiality in obtaining care (which may not be provided if they depend on their family’s resources or private insurance).
- Publicly supported clinics are sites that offer contraceptive services to the general public and use public funds (e.g., federal, state or local funding through programs such as Title X, Medicaid or the federally qualified health center (FQHC) program) to provide free or reduced-fee services to at least some patients. Sites must serve at least 10 contraceptive patients per year. These sites are operated by a diverse range of providers, including public health departments, Planned Parenthood affiliates, hospitals, FQHCs and other independent organizations.
- Private health care providers may offer publicly supported contraceptive services to women who are enrolled in Medicaid or other state-sponsored public health insurance programs. This care is typically provided in a doctor’s office and involves physicians as well as other types of clinicians.
- Female contraceptive patients are those individuals who made at least one visit for contraceptive services during the 12-month reporting period and were recorded as female according to the protocols used by each clinic. Sites were asked to report the number of all unduplicated female patients who made at least one visit and received any of the following services: a medical examination related to the provision of a contraceptive method; contraceptive supplies only (after an initial visit); contraceptive counseling and a prescription for a method, while deferring a medical examination; or a nonmedical contraceptive method, even if a medical examination was not performed, as long as a patient chart was maintained.
Methodology
Potential demand for contraception and likely need for publicly supported care
We estimated the number of US women in 2020 with a potential demand for contraceptive services and supplies and among those, the number who likely needed public support for this care by age and by income level, using three data sources:
- US Census Bureau reports for the number of women in each US county in 2020, by age-group (13–17, 18–19, 20–29 and 30–44, or 30–49 for the Supplementary Tables) and by race and ethnicity (non-Hispanic White, non-Hispanic Black, Hispanic, and other or multiple races);22
- Analysis of the 2018–2022 American Community Survey (ACS) to obtain distributions of women according to marital status (married and living with husband or not married) and family income as a percentage of the federal poverty level (FPL; less than 100%, 100–137%, 138–199%, 200–249%, and 250% or more) for each age-group by race and ethnicity;23–29 and
- Analysis of the 2015–2019 National Survey of Family Growth (NSFG) to estimate the proportion of women who have the potential to seek contraceptive services (because they were sexually experienced, able to conceive, and not pregnant or trying to become pregnant) for each demographic group (by age, race and ethnicity, marital status and income level as a percent of FPL).30
Estimates were produced by combining 2020 population data from the US Census Bureau with information on income level and marital status from the 2018–2022 ACS and characteristics of women from the 2015–2019 NSFG. We calculated the proportion of women in various population groups who met the specified criteria (detailed above in Key Definitions), which indicated their potential demand for contraceptive services and supplies during the year using the 2015–2019 NSFG, a nationally representative cross-sectional survey of 10,288 women aged 15–44 (11,695 women aged 15–49 for the supplementary tables) conducted by the National Center for Health Statistics. For each population group—defined by age, marital status, income level, and race and ethnicity in each county—we multiplied the national proportion of women with a potential demand for contraceptive services in that population group by the number of women in that population group in each county.
Estimates were made at the county level and then summed to obtain state and national estimates. Estimates for the numbers of women who had a likely need for publicly supported contraceptive care were then made by summing the relevant population groups—all women younger than 20 and adult women whose family income fell below 250% of the federal poverty level. The income level used in this definition was based on Title X eligibility guidelines, which classify patients whose income is below 250% of FPL as eligible for reduced-fee services. Patients whose income is below 100% of FPL (less than $21,720 for a family of three in 2020) are eligible for free services. Eligibility for adolescents is based on their own (not their parents’) resources, so most are eligible for free services. It is important to note that other public programs, such as Medicaid, use different income levels in their eligibility criteria that are set by state policy and are typically lower than 250% of FPL. To accommodate variation in how these estimates are used, detailed income-level groups are presented that allow users to estimate likely need for public support for services according to income levels that may be different from the ones used here.
Finally, data on the proportions of women from the ACS who are uninsured in each state were used to estimate the numbers of uninsured women who likely needed public support for contraceptive care.
For further explanation of this methodology, see the Methodology Appendix.
Women served at publicly funded clinics
We estimated the total numbers of women receiving publicly supported contraceptive care in 2020 using multiple sources. To estimate contraceptive patients served at publicly supported clinics, we collected service data for agencies and clinics that provided publicly funded family planning services in the 50 states and the District of Columbia, using similar methodology and definitions as those used in previous rounds of data collection. Specifically, we obtained the total number of female contraceptive patients served in 2020, the number of those patients who were younger than 20 and whether the clinic received funding from Title X.
Some data were provided by state-level sources, including Title X grantees and state-family planning administrators, as well as directly from the service providers. For FQHCs, we downloaded publicly available 2020 health center service delivery data from the National Health Center Program Uniform Data System (UDS).31 Agency-level patient counts were evenly distributed among their sites. We also requested and obtained data from the Indian Health Service (IHS) national office. For privacy reasons, the IHS provided regional- or area-level total female contraceptive patient counts rather than clinic-level counts. The regional-level patient counts obtained were then distributed among IHS clinics, proportionate to 2015 data distributions of patients per clinic within each area.
Among those enumerated as contraceptive patients of publicly supported clinics, a small proportion paid for their visit using private insurance or paid the full fee for services because their income was above the threshold for free or reduced-fee services. These women are counted among the total number of contraceptive patients served.
The full methodology for the collection of contraceptive service data from all publicly funded clinics is described in the Methodology Appendix.
Women receiving Medicaid-funded contraceptive services from private providers
We estimated the national number of women receiving Medicaid-funded contraceptive services from private providers, using information from the 2015–2019 NSFG30 on the type of provider respondents reported visiting for contraceptive services and how they reported paying for their visit. There are no data available to estimate the number of women who receive Medicaid-funded contraceptive services from private providers by state.
Extent to which publicly supported providers are meeting likely need for care
We estimated the extent to which publicly supported providers were meeting the likely need for public support for contraceptive care as the ratio of the number of female patients receiving publicly supported contraceptive services to the number of women who likely needed public support for contraceptive services and supplies.
It is important to note that these estimates only represent the proportion of need that is met by publicly supported providers. Some women estimated to have a likely need for public support for contraceptive services may have obtained contraceptive services or methods from other sources (including pharmacies or private providers) that they pay for out of pocket or through private health insurance.
National estimates of the extent to which potential demand for publicly supported contraceptive care is met include all women receiving contraceptive care from publicly supported clinics, as well as Medicaid patients who received such care from private providers. State estimates represent the extent to which potential demand is met by publicly supported clinics only.
This report is the source for all 2020 data in the accompanying tables and figures. Data for earlier years (numbers of women who likely need public support for contraceptive services and supplies in 2010 and 2016, and numbers of contraceptive patients served in 2010 and 2015) have most recently been published in our 2010 and 2015/2016 reports.3,6,7,32
Potential Demand and Likely Need for Publicly Supported Contraceptive Services
Information on patterns and trends in the numbers and characteristics of women who may need public support for contraceptive care is critical for the design and implementation of policies and programs aimed at providing all women with access to the care they desire. This information will also help women meet their reproductive goals and maintain their sexual and reproductive health. In addition, these data can be compared with the numbers of women who obtain care from various types of providers who offer publicly supported services to better understand service delivery patterns and to identify gaps in care.
Potential demand for contraceptive services
In 2020, there were more than 69 million US women aged 13–44, a number that increased gradually over the past decade, from 66.4 million in 2010 to 67.6 million in 2016 (Table 1).
- Certain subgroups of women experienced considerable change over the decade. For example, the number of women aged 20–44 whose family income was below 100% of the FPL rose between 2010 and 2016 (7%) but then dropped (-17%) between 2016 and 2020. Conversely, the number of women in families whose income level was above 250% FPL stayed virtually the same between 2010 and 2016 and then rose (14%) between 2016 and 2020. The number of women aged 13–44 who were of Hispanic origin rose across both time periods (11% between 2010 and 2016, and 7% between 2016 and 2020).
- More than half of all women aged 13–44 (41.8 million) had a potential demand for contraceptive services and supplies because they were sexually active, able to get pregnant, and not currently pregnant or trying to get pregnant (see Key Definitions). Overall, this represents a 12% increase across the decade, from 37.4 million in 2010 to 40.2 million in 2016 and 41.8 million in 2020.
- The largest increases in potential demand for contraceptive services and supplies over the decade were among women older than 30 (22%), women whose income was at or over 250% of poverty (26%) and Hispanic women (26%). These groups all experienced increases across both 2010 to 2016 and 2016 to 2020. Other age-groups and income groups experienced both falling and rising numbers, depending on the time period.
Likely need for publicly funded services
In 2020, 18.8 million US women were likely in need of public support for contraceptive services and supplies (Table 1 and Figure 1).
- Some 14.1 million women who likely needed public support for contraceptive services and supplies were adults living below 250% of the FPL; 5.1 million of these women had incomes below 100% of the FPL.
- Young women aged 13–19 accounted for nearly one-quarter (4.7 million) of those who likely needed public support for contraceptive services, as a result of their limited financial resources and the increased likelihood that they desired confidential care without having to depend on their families’ resources.
- Of all women who likely needed public support for contraceptive services and supplies, 8.8 million were non-Hispanic White, 3.4 million were non-Hispanic Black, 4.8 million were Hispanic, and 1.8 million were members of other or multiple racial and ethnic groups.
National trends. Overall, the number of women who likely needed public support for contraceptive care was similar in 2020 (18.8 million) to the number in 2010 (19.1 million). However, this masks considerable churn across the decade; the number of women who likely needed public support for contraceptive services peaked at 20.6 million in 2016.
- Between 2010 and 2016, the number of women who likely needed public support for contraceptive care rose by 8%—an increase of 1.5 million women. By 2020, it dropped 9%, which left the number below the 2010 figure.
- Over the entire period, likely need for public support rose the most among adult women older than age 30 (10%), with most of the increase between 2010 and 2016 and little change between 2016 and 2020. For most other groups, increases in need for publicly supported care between 2010 and 2016 were followed by declines in the numbers needing public support for contraception between 2016 and 2020.
- These trends follow from the overall drop in the number (and proportion) of all women who were under 100% of the federal poverty level between 2016 and 2020. In 2016, women under 100% FPL represented 14.6% of all women (9.9 million); in 2020, women under 100% FPL represented 11.9% of all women (8.2 million).
State variation. There was considerable variation among states in terms of change between 2010 and 2020 in both the overall population of women (change varying between -7% and 20%) and the numbers of women with potential demand for contraceptive services and supplies (change varying from 1% to 27%). Most states experienced an increase between 2010 and 2020 in these numbers (Table 2).
- Change in the numbers of women who likely needed public support for contraception also varied—from -16% to 11% among states, with most states experiencing only small shifts between time points (change for 31 states varied between -5% and 5%).
- One state (Texas) experienced a 10% or greater increase between 2010 and 2020 in the number of women who likely needed public support for contraceptive services or supplies.
- Five states (California, Illinois, Maine, New Hampshire, New York) and DC experienced 10% or greater declines in the number of women who likely needed public support for contraceptive care during this period.
State variation by characteristics. State detail on the numbers of women in 2020 who likely needed public support for contraceptive services and supplies according to age and poverty status can be found in Table 3; similar details according to race and ethnicity are available in Table 4. These data are useful for program planners or policymakers whose state or local area is interested in estimating contraceptive need for different subgroups, including in women in alternative poverty-level groups, such as those with incomes below 200% of the FPL. Appendix Tables 1 and 2 provide further state detail on the numbers of women of reproductive age and women with potential demand for contraception according to subgroups.
National and state variation in uninsured women needing care
Implementation of the ACA has provided many Americans with access to health insurance that was previously out of reach—including both public insurance obtainable through the federal-state Medicaid program and private insurance purchased through the ACA’s health insurance marketplace.33 To better understand how these shifts may be impacting likely need for contraception, we have estimated the numbers of women with a likely need for contraceptive services who have neither public nor private health insurance and compared these estimates over time, including prior data from 2010, 2013 and 2016. (We included the data for 2013 in this analysis to best capture the period immediately preceding the ACA expansions.)
It is again important to note that our overall estimates of the number of women who likely needed public support for contraceptive services are based on their eligibility for such care at Title X–funded clinics and do not consider whether they have public or private health insurance coverage. Many women have public coverage such as Medicaid, some have private coverage that is subsidized through the insurance marketplace, and some have private coverage from an employer that may or may not cover contraception and may or may not ensure confidentiality. Thus, publicly or privately insured women may choose to obtain care from publicly supported clinics for many reasons.
Overall, the estimated number of women who likely needed public support for contraceptive care who had neither public nor private health insurance fell dramatically between 2010 and 2020, with most of the change happening between 2013 and 2016, coinciding with the period in 2014 when most of the ACA’s major coverage expansions, including most of the state-level Medicaid expansions and the prohibition on allowing any copayment for contraceptive services, went into effect (Table 5).
- Between 2010 and 2020, both the number and proportion of women who likely needed public support for contraceptive care who had neither public nor private health insurance fell—from 5.8 million (30% uninsured) to 3.0 million (16% uninsured), a decline of 48%.
- Among women younger than 20 who likely needed public support for contraceptive care, most of the change in insurance status occurred earlier than for adult women, with the proportion uninsured falling from 15% in 2010 to 7% in 2020. The drop in the proportion of uninsured women, combined with the overall drop in the number of adolescents in this category, resulted in a decline in the number of uninsured adolescents who likely needed public support for contraceptive care, from 746,700 in 2010 to 312,960 in 2020.
- Among all adult women who likely needed public support with a family income below 138% of FPL (the income eligibility ceiling for Medicaid in states that expanded the program under the ACA), 39% (3.1 million women) in 2010 and 36% (3.2 million women) in 2013 were uninsured. This proportion fell to 21% (1.5 million women) in 2020, representing a 50% drop in the number of women uninsured since 2010.
State variation in insurance status. States varied widely in terms of the proportion of women who likely needed public support for contraceptive services and supplies who were uninsured, and in the level of change experienced between 2013 and 2020 in the proportions uninsured (Table 6). Most notably, there was generally a much larger drop in the proportion of uninsured women who likely needed public support for contraceptive care in those states that expanded Medicaid under the ACA, compared with the proportion of women in states that did not; the largest declines occurred between 2013 and 2016.
- Among all states that expanded Medicaid under the ACA by the end of 2020, the number of women who likely needed public support for contraceptive care who were uninsured fell 50% between 2013 and 2016 and another 12% between 2016 and 2020, for a total decline of 56% between 2013 and 2020 (from 25% to 11%). By contrast, among all states that did not expand Medicaid, the number of similar women who were uninsured fell 18% between 2013 and 2016 and 19% between 2016 and 2020, for a total decline of 28% between 2013 and 2020 (from 32% to 24%).
- In 15 states (Connecticut, Hawaii, Iowa, Kentucky, Massachusetts, Michigan, Minnesota, New Hampshire, New York, Oregon, Pennsylvania, Rhode Island, Vermont, West Virginia and Wisconsin) and DC, the proportion of women with a likely need for public support who were uninsured in 2020 was 10% or less, and all but one of these states (Wisconsin) expanded Medicaid under the ACA.
- In two states (Oklahoma and Texas), the proportion of women who likely needed public support for contraceptive care who were uninsured in 2020 was 25% or higher; the state with the highest proportion of uninsured women was Texas (35%). These states were among those with the highest proportions of women with a likely need for public support who were uninsured in 2013, and neither of them had expanded Medicaid under the ACA by the end of 2020.
Availability and Use of Publicly Funded Contraceptive Services
Providers of publicly supported contraceptive care vary widely in terms of the number of contraceptive patients served per year—and whether the provider is focused on sexual and reproductive health care or provides these services in the context of a wide offering of primary care services. Clinics that focus on sexual and reproductive health services often provide a broader mix of contraceptive methods, allowing women more choice in finding the method that is best for them, whereas clinics that focus on primary care often provide a more limited number of contraceptive methods and are less likely to have person-centered protocols that facilitate access to contraception.34 Women who obtain publicly supported care from either clinics or private providers typically receive a variety of reproductive and sexual health services, including contraceptive counseling and methods; preventive gynecologic care such as screenings for cervical cancer, chlamydia and gonorrhea; and treatment and referrals.
As noted earlier, there were policy changes between 2015 and 2020 that largely impacted the Title X program. In particular, the 2019 Final Rule contributed to nearly 1,000 providers in 30 states leaving the program, reducing the capacity of the Title X network and causing some providers to cease providing these services altogether.35 Virtually all Planned Parenthood clinics that had previously received Title X funding had left the Title X network by late 2019, although most continued to offer contraceptives and are classified here as non-Title X–funded clinics. Service delivery in 2020 was also heavily disrupted by the COVID-19 pandemic, resulting in delays, closures and lower service utilization.12–15
Publicly funded clinics
In 2020, there were 9,388 publicly funded clinics providing contraceptive services (Table 7 and Figure 2).
- One in three clinics (2,775) received federal Title X funding, and 70% (6,613) provided contraceptive services using only non-Title X sources of public funding.
- Among all clinics, 58% were run by FQHCs, 20% by public health departments, 7% by hospitals, 6% by Planned Parenthood affiliates and 9% by other independent organizations.
- Among Title X–funded clinics, 33% were run by FQHCs, 52% by public health departments, 5% by hospitals and 9% by other independent organizations. Fewer than 1% of Title X–funded clinics were run by Planned Parenthood.
Between 2015 and 2020, the total number of clinics providing publicly funded contraceptive services fell by 12%, from 10,708 to 9,388. This reversed the 2010–2015 trend of increasing numbers of publicly supported clinics offering contraceptive care.
- The increase in clinic numbers between 2010 and 2015 was due primarily to increased numbers of FQHCs providing contraceptive services (an 84% increase from about 3,200 sites in 2010 to 5,800 sites in 2015). The number of hospital clinics providing contraceptive services also increased over this time frame, while health department, Planned Parenthood and other types of clinics providing contraceptive services all decreased.
- Between 2015 and 2020, the number of clinics providing contraceptive services fell among all types of clinics, with the largest declines occurring among hospital clinics (24%) and other types of sites (25%).
The distribution of clinics according to Title X-funding status has changed considerably over the decade.
- In 2010, about half of all clinics offering publicly supported contraceptive care received funding through the Title X program. In 2015, this dropped to 35% of sites; in 2020, only 30% of publicly supported clinics received Title X funds.
- This shift is primarily due to the declining numbers of sites receiving Title X funding—a 10% decrease between 2010 and 2015, and a 25% decrease between 2015 and 2020.
- Between 2010 and 2015, the number of FQHCs receiving Title X funding increased by 71%, while for all other types, the numbers of those receiving Title X funding declined. Between 2015 and 2020, the numbers of Title X clinics of all types fell; the largest decrease (97%) was among Planned Parenthood clinics.
Between 2010 and 2015, the number of non-Title X–funded sites increased by 63%; the number then decreased slightly, by 6%, between 2015 and 2020.
- During both time periods, only the trends for non-Title X Planned Parenthood clinics ran counter to the overall trends; between 2010 and 2015, the numbers of non-Title X Planned Parenthood clinics fell by 23% (from 264 clinics to 202 clinics) and then nearly tripled between 2015 and 2020 (rising to 587 clinics, as the vast majority of Planned Parenthood sites left the Title X program).
In most states, the number of publicly funded clinics providing contraceptive services increased between 2010 and 2015 (with increases ranging from 2% to 77%) and decreased between 2015 and 2020 (with decreases ranging from -34% to -2%) (Table 8).
- Between 2010 and 2015, only three states experienced a decline in the number of clinics providing publicly supported services: Iowa (16%), Wyoming (3%) and Hawaii (2%).
- Between 2015 and 2020, nearly all states experienced declines in the number of clinics providing publicly supported contraception. Five states (Arkansas, Delaware, Hawaii, Indiana and Pennsylvania) experienced increases in clinic numbers ranging between 2% and 37%, and New Hampshire had no change.
Women served by publicly funded providers
In 2020, an estimated 7.2 million women received publicly supported contraceptive services from all sources (Table 9 and Figure 3). The majority of these women—an estimated 4.7 million contraceptive patients—were served at publicly funded clinics, based on primary data collection conducted for this report.
In addition, 2.5 million women are estimated to have received Medicaid-funded contraceptive care from private providers, based on secondary analysis of the NSFG. This analysis found that among the 25.6 million women who reported receiving at least one contraceptive service in the prior 12 months, 77% (19.7 million women) reported receiving that care at a private provider’s office; 13% (2.5 million women) of those individuals reported that Medicaid paid for their contraceptive visit.
Between 2010 and 2020, the overall number of women receiving publicly funded contraceptive services decreased from 8.9 million women to 7.2 million; virtually all of the decrease was due to a decline in the estimated number of women receiving publicly funded care from clinics.
- Among the 4.7 million contraceptive patients served by clinics in 2020 (Table 7):
- 28% (1.3 million) were served at Title X–funded clinics, and 72% (3.4 million) were served at non-Title X–funded sites;
- 38% were served at FQHCs, 33% at Planned Parenthood clinics, 13% at health departments, 9% at hospitals and 7% at other independent clinics (Figure 4); and
- 43% of those served at Title X–funded sites went to FQHCs, 1% at Planned Parenthood clinics, 37% at health departments, 7% at hospitals and 11% at other independent clinics (Table 7).
Between 2010 and 2020, the number of contraceptive patients served at publicly funded clinics declined.
- Although there was an increase in the number of clinics overall between 2010 and 2015, 7% fewer patients were served between 2010 and 2015. During the subsequent period between 2015 and 2020, the number of clinics dropped by 12%, along with a 24% drop in the number of patients served.
- Despite representing a decreasing proportion of all clinics, Planned Parenthood clinics have continued to serve large numbers of patients relative to other types of sites. In 2010 and 2015, Planned Parenthood provided the largest share of contraceptive services to patients (36% and 32%, respectively) and the second largest share (33%) in 2020.
- The number of public health department clinics declined by 8%, and these served 32% fewer patients between 2010 and 2015. Though the proportion of these clinics did not change between 2015 and 2020 (20–21% during both years), the number of patients continued to drop, with health department clinics providing services to half the number of patients in 2020 compared with the number in 2015 (about 600,000 in 2020, compared with 1.25 million in 2015).
- The overall increase in the number of FQHCs providing contraceptive care over the last decade has corresponded to FQHCs providing an increasingly larger share of contraceptive services to patients. Between 2010 and 2015, the share of contraceptive patients served by FQHCs increased from 16% of patients served in 2010 to 30% of patients served in 2015. In 2020, FQHCs accounted for the highest proportion of patients served (38%).
- Among contraceptive patients served in 2020, some 835,000 were younger than 20. This represents a 30% decline from the 1.2 million adolescents served in 2015 (Table 10).
Over both time periods (2010 to 2015 and 2015 to 2020), the majority of states, 36, experienced a drop in the number of contraceptive patients served at publicly funded clinics. Ten states experienced an increase in the number of patients served between 2010 and 2015, followed by a drop between 2015 and 2020. Four states experienced decreases or no change between 2010 and 2015 and small or negligible increases between 2015 and 2020. Only DC experienced an increase in the number of patients served at publicly supported clinics across both periods (Table 9).
Among all publicly supported clinics, an average of 500 contraceptive patients were served per clinic in 2020. This represents a decline of 35% from the 800 contraceptive patients served per clinic in 2010. Clinics vary widely according to type when comparing average numbers of contraceptive patients served per clinic during this period, with all types, except FQHCs, experiencing declines in average patients served (Table 7).
- In 2020, FQHCs, health department clinics and other types of clinics served an average of 320–410 contraceptive patients per year. In comparison, Planned Parenthood clinics each served around 2,600 patients. Hospitals served an average of 640 contraceptive patients.
- Title X–funded clinics served an average of 1,150 and 1,030 contraceptive patients per clinic in 2010 and 2015, respectively, but dropped to an average of 470 patients per clinic in 2020. In comparison, non-Title X–funded clinics served about 460 contraceptive patients per clinic during 2010 and 350 patients in 2015, but the number of patients served per clinic rose to 520 in 2020.
- Regardless of Title X funding status, Planned Parenthood clinics served the highest average number of contraceptive patients per clinic in all years (2,950 in 2010 and 2015, and 2,640 in 2020). Health departments served the lowest average number of patients per clinic in each year. Title X–funded FQHCs and other types of clinics both served around twice as many contraceptive patients on average (610 and 600 patients, respectively) in comparison to their non-Title X–funded counterparts (270 and 340 patients, respectively).
Additional details on the numbers of publicly supported clinics and contraceptive patients served according to type of provider, Title X funding status, region, state and patient age can be found in Appendix Tables 3–5.
Serving women with likely need
Comparing the number of women who obtained contraceptive care from publicly supported providers with the number of women with a likely need for such care is useful for understanding trends in access to care and variation in access across geographic locations. Looking at variation in the proportions served across time and location can help to identify patterns and gaps in access to care.
The measurement of likely need includes some women who may have obtained contraceptives without public funds from private providers or over the counter and others who may have decided not to use contraceptives, despite not planning to become pregnant. As a result, it is unlikely that publicly supported providers would serve 100% of women with a likely need for publicly supported care, except when looking at small geographic areas (small states or counties) where large numbers of patients are served who reside in adjacent states or counties.
In 2020, publicly supported providers served 39% of women who likely needed public support for contraceptive services; more than seven million of the 19 million women who likely needed such care were served. Seven percent of likely need was met by Title X–supported clinics, 18% by publicly supported clinics that do not get Title X funds and 13% by private providers serving Medicaid enrollees (Table 11 and Figure 5).
- Between 2010 and 2020, the overall proportion of likely need met by all publicly supported providers fell from 49% to 39%. Even though the overall number of women likely to have needed contraceptive services from publicly supported providers was similar across years, the number of providers providing such care and the number of patients served decreased over the period, resulting in a lower proportion of likely need being met.
- The proportion of likely need for publicly supported contraceptive care met by Title X–funded clinics fell from 25% in 2010 to 17% in 2016 and to 7% in 2020. Publicly supported clinics that did not receive Title X funds met 18% of the likely need for such care in 2020, an increase from 10% in 2010 (Table 11).
- Overall, the proportion of adolescent women whose likely need for publicly supported contraceptive care was met by all clinics fell from 30% in 2010 to 25% in 2016 and 18% in 2020. Similarly, the proportion of adolescents whose likely need for such care was met by Title X clinics also fell, even more sharply, from 22% to 14% and 5% during those years.
- The proportion of likely need for publicly supported contraceptive services met by all clinics in 2020 varied widely by state, from a low of 10% in Indiana to a high of 110% in DC (this high proportion is due to clinics in DC serving patients from surrounding states).
Trends in clinics and patients served
The data reveal large shifts between 2015 and 2020 in the network of Title X–funded clinics. These trends are unusual and differ from the patterns we have reported in previous similar reports. In 2020, many clinics that previously had Title X funding were no longer in the Title X network as a result of the domestic gag rule. Hence, these sites and their patients are included with those clinics that never were part of the Title X program.
To untangle some of these issues and better understand how changes in Title X funding among specific clinics have impacted these trends, we have divided clinics according to their Title X funding status in both years (2015 and 2020) and examined trends for these groups separately (Tables 12–14, Appendix Tables 6 and 7, and Figures 6 and 7).
- Nationally, nearly 4,800 non-Title X–funded clinics were open and provided contraceptive care in both 2015 and 2020. These clinics served about the same number of contraceptive patients in each year (1.6–1.7 million women).
- In comparison, more than 2,000 clinics were open and received Title X funding in both 2015 and 2020. These clinics served 1.6 million women in 2015, but these same clinics served only 1.1 million women in 2020.
- Similarly, nearly 1,000 clinics were open and received Title X funding in 2015, but did not receive any Title X funding in 2020. These clinics served 1.9 million contraceptive patients in 2015, but only 1.5 million in 2020.
- Finally, some clinics were only open in one of the study years, either closing or newly opening between 2015 and 2020. The relatively large number of sites that closed during this period (1,900 non-Title X and 600 Title X sites), representing nearly 25% of all 2015 sites, were replaced by only half that number of newly opened sites (860 non-Title X and 350 Title X sites), resulting in a net deficit of both clinics and patients served.
These trends can also be examined by looking at changes in the average annual number of contraceptive patients served per clinic for each group (Figure 7). While clinic groups that had received Title X funding in 2015 all had annual patient caseloads (average contraceptive patients per clinic) that were considerably higher than clinic groups that did not receive Title X funding, they also experienced much steeper drops in annual patients served per clinic between 2015 and 2020.
- Clinics that were open and received Title X funding in both years served, on average, 755 contraceptive patients per year in 2015 and only 507 contraceptive patients per year in 2020, a 33% drop.
- Similarly, clinics that received Title X funding in 2015 but left the program prior to 2020 experienced a 20% drop in average annual contraceptive patients per clinic, from 1,965 in 2015 to 1,564 in 2020.
- In contrast, those clinics that were not part of the Title X program in 2015 and remained open through 2020 had similar caseloads in both years, regardless of whether they joined Title X or remained as non-Title X sites.
- Finally, not only did fewer clinics open between 2015 and 2020 than the number that closed, those that did open served on average fewer patients in 2020 than similar sites in 2015 (for non-Title X sites, only 4% fewer patients per clinics, but the newly opened Title X sites served 30% fewer patients per clinic, compared with the number previously served by the Title X sites that closed).
While it is difficult to tease out the impact of COVID-19 versus Title X policy changes, the combination of these challenges appears to have had a greater impact on contraceptive service provision among Title X–funded clinics than among clinics that do not receive Title X funding. To examine this further, we looked at variation among states (Appendix Tables 6 and 7) and then grouped states according to the response of Title X grantees and clinics in the state to the 2019 Title X Final Rule† and the severity of COVID-19 in the state‡ (Tables 13 and 14). This analysis is similar in approach to an earlier analysis10 of change in 2020 that looked only at Title X–funded sites; here, we look more broadly at the full network of clinics and at sites that remained open even after leaving the Title X network.
- Similar to clinics nationally, Title X–funded clinics in all three state groups experienced greater drops in patient caseloads between 2015 and 2020 than non-Title X clinics. (Clinics that received Title X funding in both years experienced caseload declines of 18% to 36%; caseloads for sites that lost Title X funding between 2015 and 2020 declined by 17% to 36%, depending on the state group.)
- However, non-Title X clinics operating in states where all or some grantees left the Title X program saw increases in patient caseloads—a 14% increase for clinics that were open and not receiving Title X funding in both years and a 93% increase in patient caseloads among those small number of clinics that gained Title X funding between 2015 and 2020. Non-Title X clinics in other states experienced some decline in patient caseloads (-10% to -14%), but these declines were much lower than the caseload drops experienced by Title X clinics.
- Similar patterns are found when looking at state groups according to the severity of COVID-19. For all state groups, Title X–funded clinics experienced sharp drops in average annual patient caseloads without a clear pattern related to the severity of COVID-19 in the state.
- However, among non-Title X clinics (those that were open and did not receive Title X funding in either year), there was a greater decline in contraceptive patient caseloads among states, depending on the severity of COVID-19 in the state. Clinics in states with the lowest COVID-19 mortality rates saw an increase of 16% in average patient caseload; clinics in states with mid-range COVID-19 mortality rates experienced a small decrease in patient caseloads (-7%), while clinics in states with the highest COVID-19 mortality rates experienced the largest drop in contraceptive patient caseload (-19%).
Discussion
Trends in contraceptive need and patients served
Over the past decade, the number of US women with a potential demand for contraceptive services and supplies rose steadily, from 37.4 million in 2010 to 41.8 million in 2020. These estimates are based on the conventional way of measuring need for contraception which focuses on women’s potential for conceiving an unintended pregnancy; it is not based on women’s actual expression of needing or wanting to use contraceptives. The authors of this report are preparing an article that presents an alternative, more person-centered metric for measuring contraceptive need, and makes comparisons between the new metric and the conventional way of measuring need used here and in prior similar reports. We anticipate using the new measure in future reports.
Estimates of the number of women who likely needed public support for contraceptive services and supplies increased from 19.1 million in 2010 to 20.6 million in 2016 (an 8% rise) and then dropped to 18.8 million by 2020 (a 9% fall). Some of these shifts were due to population increases in women overall, particularly women older than 30 and women of color. However, the rise and fall over the decade in the proportion of women with a likely need for publicly supported care largely mirrored trends in the proportion of women living in poverty. Between 2010 and 2016, the proportion of women living in poverty rose, mirroring growing income disparities in the United States over the period.36 This trend reversed midway through the decade, and the proportion of women living in poverty fell gradually during the second half of the decade.37
The net impact of these competing demographic and economic changes meant that the number of women who likely needed publicly funded contraceptive care was largely the same in 2020 as it was in 2010 (19.1 million vs. 18.8 million). However, due in large part to the Affordable Care Act, the number and proportion of these women who have neither public nor private health insurance dropped sharply between 2010 and 2020, falling from 5.8 million to 3.0 million uninsured women with a likely need for publicly funded contraceptive care.
Between 2010 and 2020, the overall number of women who received publicly supported contraceptive care dropped sharply (from 8.9 million to 7.2 million), resulting in a decline in the proportion of women with a likely need for publicly supported care who were served (from 49% to 39%). This comparison considers all women with a likely need for publicly supported care, whether or not they had health insurance. We cannot compare the number of women served with the estimates made for uninsured women who likely needed publicly supported care because publicly supported providers are a key source of care for those with public insurance. Similarly, adolescents and others who rely on a family member’s private insurance may be seeking confidential care without having to use their insurance.
Between 2010 and 2020, the number of US women receiving publicly supported contraceptive care from all publicly supported clinics fell from 6.7 million contraceptive patients to 4.7 million—and among Title X–funded clinics, the number of contraceptive patients fell from 4.7 million in 2010 to 1.3 million in 2020.
The decline in contraceptive patients served by publicly supported clinics is likely due to several factors that have disrupted the network of providers offering this care and suggests that access to quality and affordable contraceptive care may have declined over the decade. At the same time, there are unmeasured factors, such as use of private insurance or over-the-counter contraceptives, that some women who likely need publicly supported care may be relying on to meet their reproductive goals. In fact, among women who are able to conceive, have had recent sex and are not pregnant or trying to get pregnant, 90% are using some form of contraception.38
However, high levels of contraceptive use do not necessarily mean that people’s contraceptive preferences are being fully met. Some women who are using nonprescription methods, such as condoms, may not be using the method they would ideally use if they had better access to their preferred source of care39,40 and were able to choose from a wide range of available methods. In addition, women who rely on nonprescription contraceptive methods because they are unable to access publicly supported care may also be forced to forgo cancer or STI screenings that they would have wanted.
Publicly supported family planning helps people more fully access and afford the services they want and need. Title X clinics, in particular, provide more comprehensive SRH services than non-Title X–funded clinics. They offer their patients a greater variety of contraceptive methods, do more to facilitate method initiation and consistent method use, are more likely to advise patients about contraceptives during annual gynecologic visits, and spend more time counseling patients about contraception and sexual health than clinics that do not receive Title X funding.34,41–43
Network changes in publicly supported care
During the first half of the decade, some of the shifts in contraceptive service provision among publicly supported clinics were driven by shifting public funding streams—Title X funding fell and funding for FQHCs (a majority of all non-Title X–funded sites) rose. Specifically, between 2010 and 2015, federal appropriations to the Title X program decreased steadily from a high of $317 million in 2010 to $286 million in 2015, where it has remained each year since, with no increase and no adjustments for inflation.44 Also, in many states and communities, shrinking state budgets, as well as targeted reductions in funding for specific programs or grantees, contributed to clinic closures and reductions in clinic services, especially among Title X–funded sites.
At the same time, federal appropriations for community health centers, authorized under Section 330 of the Public Health Services Act, more than doubled, from $2.3 billion in 2010 to $4.9 billion in 2015.45 These funding increases contributed to the rise in both the number of FQHCs providing contraceptive care and the number of contraceptive patients served. Between 2010 and 2015, the number of FQHCs providing contraceptive services increased from 3,165 to 5,829, an 84% increase; the numbers of contraceptive patients served rose 78%.
During the second half of the decade, and primarily during the period 2019 to 2020, a different set of competing factors contributed to an unprecedented drop in the number of contraceptive patients served by publicly supported clinics and in the changes in where US women receive this care. The share of women receiving contraceptive services from a Title X–funded clinic fell from 61% in 2015 to 28% in 2020. The steep drop in service provision at Title X–funded clinics was impacted by both the domestic gag rule (the 2019 Final Rule) and the COVID-19 pandemic, with different patterns experienced by each clinic group.
- First, some 1,000 clinics chose to leave the Title X program in 2019 as a result of the domestic gag rule. These sites served about one-third of all clinic patients and about half of all Title X patients in 2015. Although they remained open and served contraceptive patients in 2020 without Title X funding, the combined impact of both losing Title X funding and the COVID-19 pandemic led to a 20% reduction in average patient caseloads between 2015 and 2020.
- Second, those clinics that remained in the Title X program throughout the period from 2015 to 2020 served one-third fewer patients in 2020. Although this drop was likely due in large part to the COVID-19 pandemic, it is interesting to note that the drop in average contraceptive patient caseloads for Title X–funded clinics was much larger than the drop experienced by non-Title X–funded clinics and varied widely by state, though not in any clear pattern according to either the state’s response to the gag rule or the severity of COVID-19 in the state.
- Third, some of the decline in contraceptive patients served between 2015 and 2020 can be attributed to clinics that closed or stopped offering contraceptive care during the period and were not offset by new clinics taking their place. This was more common among non-Title X sites; nearly 40% of those offering contraceptive care in 2015 did not do so in 2020; among Title X–funded sites, about 20% of those offering care in 2015 did not do so in 2020. Because the average caseload of clinics that were operating only in 2015 is relatively low, the impact on the decline in contraceptive patients served is not as large—for non-Title X clinics, the net impact of clinic closures is about 18% fewer contraceptive patients served and for Title X clinics, closures accounted for a net loss of 5% of contraceptive patients.
These patterns suggest that the combined impact of COVID-19 and the domestic gag rule differed among publicly supported clinics. There were steep decreases in average contraceptive patients served per clinic experienced by those Title X clinics that were open in both 2015 and 2020, but fewer outright closures of these clinics.
By contrast, non-Title X clinics that stayed open in both years had only minor decreases in the average numbers of contraceptive patients served, but a much higher percentage of such clinics closed or stopped offering contraceptive services. These clinics also appeared to have been affected by the severity of the COVID-19 pandemic in a particular state: Non-Title X clinics in states with the lowest COVID-19 mortality rate served more contraceptive patients in 2020 than the number served in 2015, and clinics in states with the highest mortality rates experienced a drop in average contraceptive patient caseload.
Conclusion
Further research is needed to more fully understand the factors that contributed to changes in the publicly supported network of clinics and its capacity to serve contraceptive patients, especially to assess how clinic type and level of state support may have mitigated or exacerbated the impacts of the domestic gag rule and COVID-19 on service delivery in 2020.
Research is also needed to continue to monitor where women go for publicly supported contraceptive care, what the consequences of changes to the clinic network are, and how the network of providers manages as it adapts to ongoing funding and policy changes. The federal Title X family planning program remains critical to the provision of clinic-based contraceptive care. And, although there was a significant decline in the number of patients served at Title X–funded clinics that was lowest in 2020, recent data from the Office of Population Affairs Family Planning Annual Report indicate the program has experienced increasing patient numbers in each year since.46 Moreover, Title X–funded sites serve, on average, a greater number of contraceptive patients per clinic than do most clinics not funded by Title X.
In addition, given the increasing importance of non-Title X clinic providers in serving women’s contraceptive and other reproductive health needs, it is important that they receive support and guidance in how to better meet the full scope of what women want from a contraceptive service provider. Notably, the federal government has played an important role in creating guidelines for the provision of quality family planning services47 that can be used by both public and private providers to ensure that best practices are followed by all contraceptive service providers.
The landscape of publicly funded contraceptive service provision, as well as measurement of the need for care, has evolved since 2020. Later this year, a new, more person-centered metric for measuring contraceptive need will be introduced; it will be used for future-need estimate updates.
The challenges of 2020 have only been compounded in the years since—the Dobbs v. Jackson Women’s Health Organization decision in June 2022 and the ensuing fallout have impacted family planning provision, Title X remains chronically underfunded and faces the threat of a new domestic gag rule, and other potential policies may compromise Title X, Medicaid coverage and ACA contraceptive coverage guarantees, among some of the potential challenges. In fact, for fiscal year 2025, 16 Title X grantees have had their funding withheld and others have received less than anticipated.48 Continued monitoring of the publicly supported family planning network and the people who depend on this care will remain critical for understanding and documenting policy impacts.
Suggested Citation
Frost J et al., Publicly Supported Family Planning Services in the United States, 2020, New York: Guttmacher Institute, 2025, https://www.gutttmacher.org/report/publicly-supported-FP-services-US-2020.
Acknowledgments
This report was prepared by Jennifer Frost, Nakeisha Blades, Ayana Douglas-Hall, Mia Zolna, Audrey Maynard, Samira Sackietey, Tamrin Ann Tchou and Bashiru Mohammed, all of the Guttmacher Institute. It was edited by Peter Ephross. The authors performed all data analyses and tabulations.
The authors thank the following former Guttmacher colleagues for research assistance: Mira Tignor and Rayan Sadeldin. The authors also thank the following Guttmacher colleagues for reviewing drafts of this report: Megan Kavanaugh, Amy Friedrich-Karnik and Emma Stoskopf-Ehrlich.
This study was made possible by grants to the Guttmacher Institute from an anonymous donor and from the Office of Population Affairs (OPA) of the US Department of Health and Human Services (HHS) (Grant# FPRPA006074). The contents are those of the authors and do not necessarily represent the official views of, nor an endorsement, by OPA, HHS or the US government. The findings and conclusions in this report are those of the authors and do not necessarily reflect the positions and policies of the donors.
Footnotes
*Estimates are based on individuals who have ever had voluntary sex, not those who have been sexually active in the past one or three months, because the intent of this indicator is to measure the potential number of women who may decide to seek contraceptive services at any time over a one-year period.
†States have been classified into three groups according to the response of grantees and/or clinics in the state to the 2019 Title X Final Rule: States where one or more Title X grantees left the program, states where individual sites left the Title X program, and states where no grantees or sites left Title X in response. (See Table 13 for information that details which states are included in each group.)
‡COVID-19 status is grouped this way: Best COVID-19=standardized death rate of less than 329 per 100,000 people. Mid-COVID-19=standardized death rate between 329 and 426 per 100,000 people. Worst COVID-19=standardized death rate of more than 426 deaths per 100,000 people.
References
1. Hart J, Crear-Perry J and Stern L, US sexual and reproductive health policy: Which frameworks are needed now, and next steps forward, American Journal of Public Health, 2022, 112(S5):S518–S522, https://doi.org/10.2105/AJPH.2022.306929.
2. Centers for Disease Control and Prevention, NSFG key statistics from the National Survey of Family Growth: ever use of contraceptive methods, last reviewed 2022, https://www.cdc.gov/nchs/nsfg/key_statistics/c-keystat.htm.
3. Frost JJ et al., Publicly Funded Contraceptive Services at US Clinics, 2015, New York: Guttmacher Institute, 2017, https://www.guttmacher.org/report/publicly-funded-contraceptive-service….
4. Frost JJ, Frohwirth LF and Purcell A, The availability and use of publicly funded family planning clinics: US trends, 1994–2001, Perspectives on Sexual and Reproductive Health, 2004, 36:206–215, https://www.guttmacher.org/journals/psrh/2004/availability-and-use-publ….
5. Guttmacher Institute, Contraceptive Needs and Services, 2006, New York: Guttmacher Institute, 2009, https://www.guttmacher.org/sites/default/files/report_pdf/contraceptive….
6. Frost J, Zolna M and Frohwirth L, Contraceptive Needs and Services, 2010, New York: The Alan Guttmacher Institute (AGI), 2013, https://www.guttmacher.org/sites/default/files/pdfs/pubs/win/contracept….
7. Frost JJ et al., Publicly Supported Family Planning Services in the United States: Likely Need, Availability and Impact, 2016, New York: Guttmacher Institute, 2019, https://www.guttmacher.org/report/publicly-supported-FP-services-US-2016.
8. Hasstedt K and Dawson R, Title X Under Attack—Our Comprehensive Guide, Policy Analysis, Guttmacher Institute, 2019, https://www.guttmacher.org/article/2019/03/title-x-under-attack-our-com….
9. Lord-Biggers M and Friedrich-Karnik A, Challenges to the Title X Program, Fact Sheet, Guttmacher Institute, 2025, https://www.guttmacher.org/fact-sheet/challenges-title-x-program?gad_so…
10. Fowler CI, Gable, J and Lasater B, Family Planning Annual Report: 2020 National Summary, Washington, DC: Office of Population Affairs, Office of the Assistant Secretary for Health, Department of Health and Human Services. 2021, https://opa.hhs.gov/sites/default/files/2021-09/title-x-fpar-2020-natio…
11. VandeVusse A et al., Publicly Funded Clinics Providing Contraceptive Services in Four US States: The Disruptions of the “Domestic Gag Rule” and COVID-19, New York: Guttmacher Institute, 2023, https://doi.org/10.1363/2023.300323.
12. Kavanaugh ML et al., Financial instability and delays in access to sexual and reproductive health care due to COVID-19, Journal of Women’s Health, 2022, 31(4):469–479, https://doi.org/10.1089/jwh.2021.0493.
13. Johnson KJ et al., Assessment of the impact of the COVID-19 pandemic on health services use, Public Health in Practice (Oxford, England), 2022, 3:100254, https://doi.org/10.1016/j.puhip.2022.100254.
14. VandeVusse A et al., Disruptions and opportunities in sexual and reproductive health care: How COVID‐19 impacted service provision in three US states, Perspectives on Sexual and Reproductive Health, 2022, 54(4):188–197, https://doi.org/10.1363/psrh.12213.
15. Roberts SCM, Schroeder R and Joffe C, COVID-19 and independent abortion providers: Findings from a rapid-response survey, Perspectives on Sexual and Reproductive Health, 2020, 52(4):217–225, https://doi.org/10.1363/psrh.12163.
16. Easter R, Friedrich-Karnik A and Kavanaugh ML, Any Restrictions on Reproductive Health Care Harm Reproductive Autonomy: Evidence from Four States, New York: Guttmacher Institute, 2024, https://doi.org/10.1363/2024.300471.
17. Dawson R, Trump administration’s domestic gag rule has slashed the Title X network’s capacity by half, Policy Analysis, Guttmacher Institute, 2020, https://www.guttmacher.org/article/2020/02/trump-administrations-domest….
18. AGI, Women at Risk: The Need for Family Planning Services, State and County Estimates, 1987, New York, 1988.
19. Henshaw SK and Darroch J, Women at Risk of Unintended Pregnancy, 1990 Estimates: The Need for Family Planning Services, Each State and County, New York: AGI, 1993.
20. Henshaw SK, Frost JJ and Darroch, Contraceptive Needs and Services, 1995, with Selected Articles from Family Planning Perspectives, New York: AGI, 1997.
21. US National Archives, Annual update of the HHS poverty guidelines, Federal Register, 2020, https://www.federalregister.gov/documents/2020/01/17/2020-00858/annual-….
22. US Census Bureau, Annual county resident population estimates by age, sex, race, and Hispanic origin: April 1, 2020 to July 1, 2021, published 2022, https://www2.census.gov/programs-surveys/popest/datasets/2020-2021/coun….
23. US Census Bureau, 2018 American Community Survey, PUMS data, https://www.census.gov/programs-surveys/acs/microdata/access.2018.html#….
24. US Census Bureau, 2019 American Community Survey, PUMS data, https://www.census.gov/programs-surveys/acs/microdata/access.2019.html#….
25. US Census Bureau, 2020 American Community Survey, PUMS data, https://www.census.gov/programs-surveys/acs/microdata/access.2020.html#….
26. US Census Bureau, 2018 American Community Survey, PUMS documentation, https://www.census.gov/programs-surveys/acs/microdata/documentation.201….
27. US Census Bureau, 2019 American Community Survey, PUMS documentation, https://www.census.gov/programs-surveys/acs/microdata/documentation.201….
28. US Census Bureau, 2020 American Community Survey, PUMS documentation, https://www.census.gov/programs-surveys/acs/microdata/documentation.202….
29. US Census Bureau, 2018–2022 American Community Survey, public microdata samples, https://www2.census.gov/programs-surveys/acs/data/pums/2022/5-Year.
30. Centers for Disease Control and Prevention, National Center for Health Statistics, National Survey of Family Growth 2015–2017 and 2017–2019 female respondent public use data, https://ftp.cdc.gov/pub/Health_Statistics/NCHS/Datasets/NSFG/.
31. Health Resources and Services Administration, National Health Center Program Uniform Data System: Health Center Program grantee data, 2020, https://www.hrsa.gov/foia/electronic-reading.
32. Frost J, Contraceptive Needs and Services in the United States, 1994–2016, Inter-university Consortium for Political and Social Research [distributor], 2024, https://doi.org/10.3886/ICPSR38891.v1.
33. Sonfield A, US Insurance Coverage, 2018: The Affordable Care Act Is Still Under Threat and Still Vital for Reproductive-Age Women, New York: Guttmacher Institute, 2020, https://www.guttmacher.org/2020/01/us-insurance-coverage-2018-affordabl….
34. VandeVusse A et al., Publicly Supported Family Planning Clinics in 2022–2023: Trends in Service Delivery Practices and Protocols, New York: Guttmacher Institute, 2024, https://doi.org/10.1363/2024.300607.
35. Frederiksen B, Gomez I and Salganicoff A, Rebuilding the Title X Network Under the Biden Administration, 2023, KFF, https://www.kff.org/womens-health-policy/issue-brief/rebuilding-the-tit….
36. US Congressional Budget Office, Trends in family wealth, 1989 to 2013, published 2016, https://www.cbo.gov/publication/51846.
37. Shrider EA, US Census Bureau, Current Population Reports, P60-283, Poverty in the United States: 2023, Washington, DC: US Government Publishing Office, 2024, https://www2.census.gov/library/publications/2024/demo/p60-283.pdf.
38. Kavanaugh ML and Pliskin E, Use of contraception among reproductive-aged women in the United States, 2014 and 2016, F&S Reports, 2020, 1(2):83–93, https://doi.org/10.1016/j.xfre.2020.06.006.
39. Kavanaugh ML and Zolna MR, Where do reproductive-aged women want to get contraception? Journal of Women’s Health, 2023, 32(6), https://doi.org/10.1089/jwh.2022.0406.
40. Gomez AM et al., Estimates of use of preferred contraceptive method in the United States: a population-based study, The Lancet Regional Health—Americas, 2024, 30:100662, https://doi.org/10.1016/j.lana.2023.100662.
41. Zolna M and Frost J, Publicly Funded Family Planning Clinics in 2015: Patterns and Trends in Service Delivery Practices and Protocols, New York: Guttmacher Institute, 2016, https://www.guttmacher.org/report/publicly-funded-family-planning-clini….
42. Frost JJ et al., Variation in Service Delivery Practices Among Clinics Providing Publicly Funded Family Planning Services in 2010, New York: Guttmacher Institute, 2012, https://www.guttmacher.org/report/variation-service-delivery-practices-….
43. Frost JJ, US Women’s Use of Sexual and Reproductive Health Services: Trends, Sources of Care and Factors Associated with Use, 1995–2010, New York: Guttmacher Institute, 2013, https://www.guttmacher.org/report/us-womens-use-sexual-and-reproductive….
44. HHS Office of Population Affairs, Title X program funding history, https://opa.hhs.gov/grant-programs/archive/title-x-program-archive/titl….
45. National Association of Community Health Centers, Federal grant funding, https://www.nachc.org/policy-advocacy/health-center-funding/federal-gra….
46. Killewald P et al., Family Planning Annual Report: 2023 National Summary, Office of Population Affairs, Office of the Assistant Secretary for Health, US Department of Health and Human Services, 2024, https://opa.hhs.gov/sites/default/files/2024-10/2023-FPAR-National-Summary-Report.pdf.
47. Gavin L and Pazol K, Update: Providing quality family planning services — recommendations from CDC and the US Office of Population Affairs, 2015, MMWR Morbidity and Mortality Weekly Report, 2016, 65(9):231–234, https://doi.org/10.15585/mmwr.mm6509a3.
48. Kavanaugh ML et al., Trump administration’s withholding of funds could impact 30% of Title X patients, Policy Analysis, New York: Guttmacher Institute, 2025, https://www.guttmacher.org/2025/04/trump-administrations-withholding-funds-could-impact-30-percent-title-x-patients.